
Blog
When Private Equity Meets the Data Center Gold Rush
Research
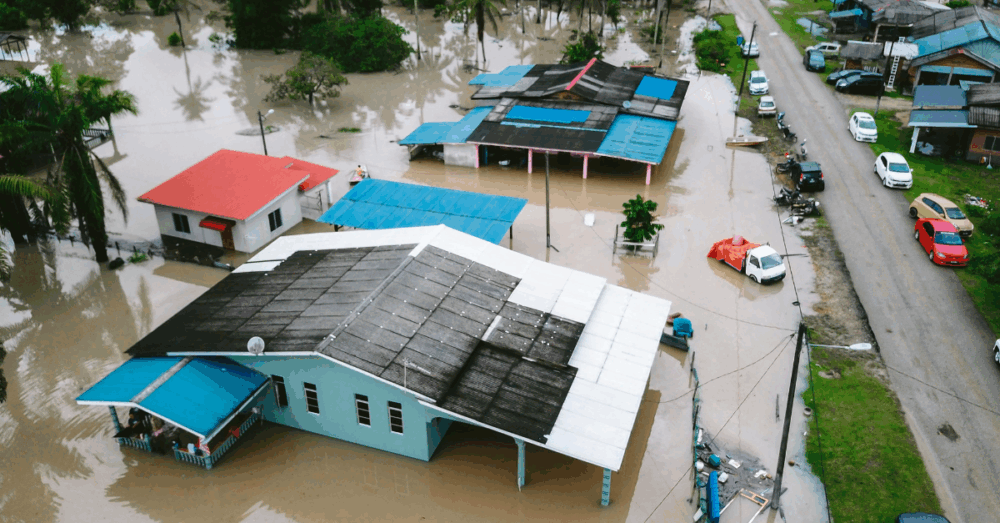
Our built environment is designed with thresholds in mind. A building may withstand a few feet of flooding but sustain major damage if the waters rise higher. A transmission line can be engineered for certain wind speeds, but stronger gusts bring it down. Heat can drive demand on the grid higher while also straining the very equipment that keeps it operating.
In a stable climate, the probability of crossing these limits is predictable. A “hundred-year flood” is assumed to occur, on average, once every century. That assumption is not just technical. It shapes how infrastructure is financed, how insurers price risk, how governments plan budgets, and how safety systems are designed to protect lives.1
But what happens when those probabilities change, when what was once a hundred-year event starts occurring every decade or even every few years?
It is widely recognized that extreme events are becoming more frequent. What many people describe anecdotally, that “hundred-year floods” now seem to happen every few years, is confirmed by data. Using the latest climate datasets, we can see the statistical reality: events once considered rare are happening with increasing regularity and are crossing thresholds built into our infrastructure.
The graph below shows how summertime temperatures in the Northern Hemisphere have shifted over time. The Y-axis represents how often particular temperatures occurred. The X-axis shows how far those temperatures deviated from the historical average (1901–2015). Each line represents a different time period, showing how the distribution has shifted across decades.2

Immediately apparent is that the distributions are shifting to the right. The 1960s and 1970s were cooler than average, but each period since has been warmer. What’s less obvious is that even minor shifts in the mean create significant increases in the frequency of tail events. On the right side of the curves, new areas of probability appear where there were essentially no observations in earlier decades.
We see the quantitative effect of these expanding tails in the chart below. The results are dramatic. Temperatures two standard deviations above the historical mean are now about 27 times more likely than they were in the 1960s and 1970s. Events three standard deviations above the mean are nearly 200 times more likely. Most sobering, we now see extremes with no precedent at all. Between 2020 and 2024, 2.2% of observations were four standard deviations above the mean, and 0.26% were five standard deviations above. This contrasts with essentially zero events at these extremes in earlier decades.
| 1961-1980 | 1981-2000 | 2001-2010 | 2011-2020 | 2020-2024 | |
| % of observations 2SD above mean | 1.5% | 5.1% (3.4x) | 15.3% (10x) | 24.7% (16.2x) | 40.7% (26.7x) |
| % of observations 3SD above mean | 0.07% | 0.6% (9.1x) | 3.2% (47.4x) | 5.5% (80.9x) | 13.3% (195x) |
| % of observations 4SD above mean | 0% | 0.03% | 0.3% | 0.4% | 2.2% |
| % of observations 5SD above mean | 0% | 0% | 0% | 0.02% | 0.26% |
This is the statistical reality behind the widespread sense that events once considered rare are happening with exponential frequency. It is also the sobering recognition that we are moving into uncharted territory. The physical reality is unprecedented temperatures around the world3 — and the risks to crops, ecosystems, and human life that follow.
We are used to stability. But the climate is no longer stable. Even small shifts in averages, such as 1.5 degrees Celsius (2.7 degrees Fahrenheit) of warming, drive dramatic, non-linear, increases in tail events. These extremes will test the thresholds built into our infrastructure and challenge not only architects and engineers but also investors, insurers, bankers, and policymakers. The imperative is clear: decarbonize, adapt, and prepare. Because what was once rare now happens with a frequency that earlier generations would have considered impossible.
[1] For more detail on bend and break points of various infrastructure classes, see “Will infrastructure bend or break under climate stress?”
[2] Data obtained from the University of East Anglia’s Climate Research Unit long-term temperature reanalysis dataset.
[3] Source: “Extreme heat is breaking records worldwide: UN weather agency”
Footnotes and Sources
Northern Hemisphere temperature datasets, 1901–2015 mean and 2020–2024 update.
Statistical multipliers (× values) derived from observed frequency shifts in temperature distributions.
Examples of unprecedented heat events cited from recent observational records: Libya, Pakistan, Arizona, Oregon (2020–2024).
Context: IPCC Sixth Assessment Report (2021) and related peer-reviewed literature on extremes and distribution shifts.
Blog

Blog
Blog